DB1BM Airline Mapper
I decided not to maintain this page, since I combined the map into the dashboard below.

I decided not to maintain this page, since I combined the map into the dashboard below.
I decided not to maintain this page, since I combined the map into the dashboard below.
Note: the DB1B database is taken offline in April 2018 due to database size.
This form provides historical airline ticket price, or more specifically, historical domestic average one-way fares, extracted from Department of Transportation's DB1B database.
For example, if we input LAX as origin and SFO as destination and click "Submit", we will find out 7 airlines offering nonstop services and majority of fares were between $50 and $100 in 1Q2012. If we prefer, we can narrow down the search to "VX" "Non-Stop" and "$10" incremental, we will then find majority of VX nonstop tickets were between $60 and $70. You can find airport and airline codes at this link.
For people not familar with this database:
Note: my form suddenly requires a login now. For the moment, please use this link.
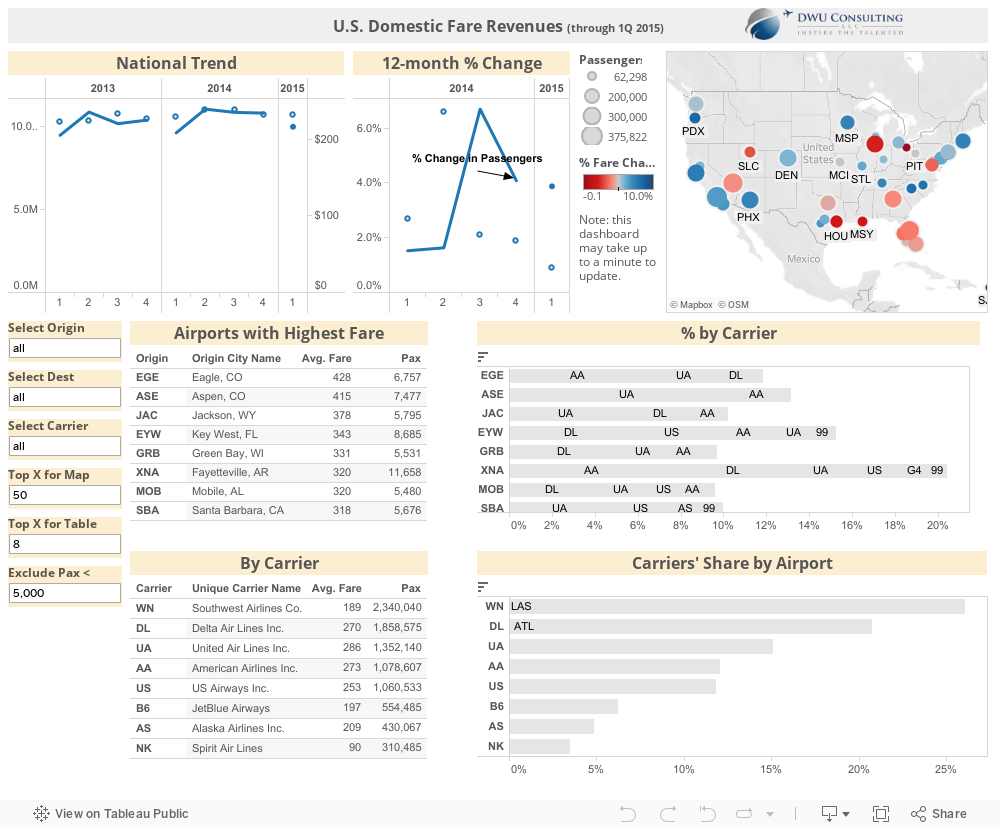
The dashboard below provides a quick overview.